Multiple Choice
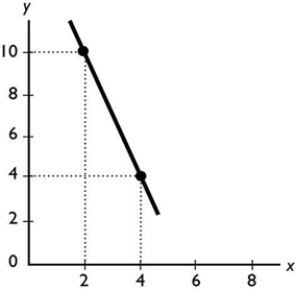
 The slope of the line shown in the above figure is
A) -5.
B) -1.
C) -3.
D) -1/3.
E) -10.
Correct Answer:

Verified
Correct Answer:
Verified
Related Questions
Q9: <img src="https://d2lvgg3v3hfg70.cloudfront.net/TB7671/.jpg" alt=" -In the diagram
Q16: 'Lower ticket prices would lead to more
Q18: Economics is best defined as the social
Q21: Which of the following is an example
Q43: The figure above shows the relationship between
Q45: The primary focus of microeconomics is<br>A) to
Q59: Choices that are best for the society
Q76: If a curve falls and then rises,
Q93: Your lecturer changes the penalty for cheating
Q121: A graph shows the price of a