Multiple Choice
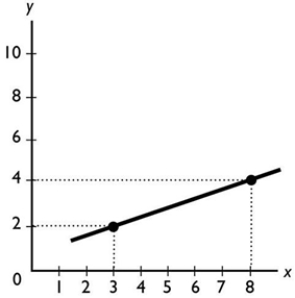 The slope of the line shown in the above figure is
A) 5/2.
B) 5.
C) 2/3.
D) 2/5.
E) 2.
Correct Answer:

Verified
Correct Answer:
Verified
Related Questions
Q14: A positive statement:<br>i. makes a statement about
Q21: <img src="https://d2lvgg3v3hfg70.cloudfront.net/TB8401/.jpg" alt=" In the figure
Q26: You have data for sales of pizza
Q75: Jamie has enough money to buy either
Q91: A graph showing the values of an
Q97: When Gabriel made a rational choice to
Q99: When the Adelaide Crows score more than
Q100: Demonstrating how an economic variable changes from
Q102: The opportunity cost of a decision is
Q197: A linear relationship<br>A) when graphed is a