Multiple Choice
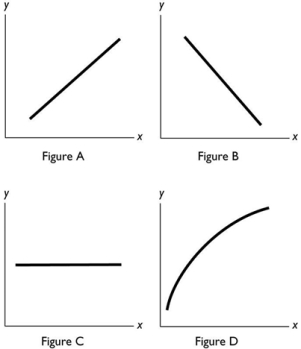 In the above figure, which of the figures show a relationship between x and y with a negative slope?
A) Figure A
B) Figure B
C) Figure C
D) Figure D
E) Both Figure A and Figure B
Correct Answer:

Verified
Correct Answer:
Verified
Related Questions
Q7: <img src="https://d2lvgg3v3hfg70.cloudfront.net/TB7671/.jpg" alt=" -In the diagram
Q14: A positive statement:<br>i. makes a statement about
Q27: An opportunity cost is<br>A) the benefits of
Q32: Suppose that, instead of taking this test,
Q44: On a graph showing the relationship between
Q58: When an electricity distribution company decides to
Q91: A graph showing the values of an
Q98: A cross-section graph<br>A) shows the values of
Q119: Which economic question depends on the incomes
Q324: A normative statement<br>i.can be tested as to