Multiple Choice
Figure 3-1 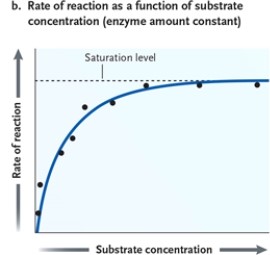
-Refer to Figure 3-1. Suppose you conduct an experiment in the laboratory in which you add increasing amounts of substrate to a solution containing an enzyme and a pH buffer. You incubate the container at the optimal temperature for the enzyme. Each time you add more substrate, you measure the rate of the reaction. Also suppose that you graph the results such that the x-axis shows the substrate concentration and the y-axis shows the resulting reaction rate. What will you find over time?
A) The rate of the reaction will increase rapidly, taper off, and plateau.
B) The resulting graph will be a perfect bell curve.
C) The rate of the reaction will increase slowly, plateau, and then drop sharply back to zero.
D) The rate of the reaction will proceed with a slope of 1 and continue in a linear fashion indefinitely or until you run out of reactants.
Correct Answer:

Verified
Correct Answer:
Verified
Q10: Which of the following can be said
Q11: Which of the following best explains why
Q12: Explain how temperature can affect enzyme activity.
Q13: Which of the following best describes why
Q14: AMP is the primary energy and phosphate
Q16: Match each definition with the corresponding term.<br>-ATP<br>A)primary
Q17: Which of the following is a correct
Q18: Match each definition with the corresponding term.<br>-transition
Q19: Which of the following best describes why
Q20: Figure 3-5 <img src="https://d2lvgg3v3hfg70.cloudfront.net/TB8444/.jpg" alt="Figure 3-5