Multiple Choice
Figure 3-5 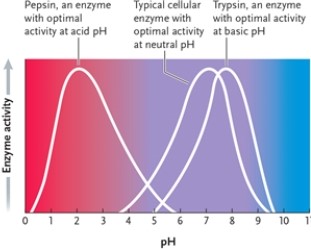
-According to the graph in Figure 3-5, what is the optimal pH for enzyme 1?
A) 2
B) 3
C) 4
D) 5
Correct Answer:

Verified
Correct Answer:
Verified
Related Questions
Q4: Which of the following best illustrates the
Q5: Figure 3-1 <img src="https://d2lvgg3v3hfg70.cloudfront.net/TB8444/.jpg" alt="Figure 3-1
Q6: Enzymes do not change the ΔG of
Q7: Which of the following occurs when a
Q8: Which of the following best describes a
Q10: Which of the following can be said
Q11: Which of the following best explains why
Q12: Explain how temperature can affect enzyme activity.
Q13: Which of the following best describes why
Q14: AMP is the primary energy and phosphate