Multiple Choice
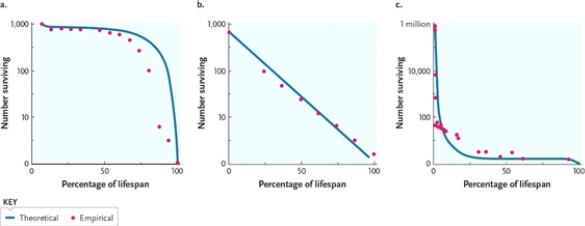
Figure 29-1 
-Sea turtles are likely to die when they are young, but if they reach a large size, they have a good chance of surviving. Which survivorship curve in Figure 29-1 best fits sea turtles?
A) type I, shown in graph C
B) type II, shown in graph B
C) type III, shown in graph A
D) type III, shown in graph C
Correct Answer:

Verified
Correct Answer:
Verified
Q27: Match each description to an equation.<br>-exponential model
Q28: Categorize each trait as belonging predominantly to
Q29: Use the list of terms to identify
Q31: Match each description to an equation.<br>-per capita
Q33: Match each term with its definition.<br>-age-specific fecundity<br>A)population
Q34: A cohort is a group of individuals
Q35: Match each term with its definition.<br>-logistic model<br>A)population
Q36: Use the list of terms to identify
Q37: Clumped populations may reflect the distribution of
Q42: Logistic population growth describes growth without limitation.