Multiple Choice
Figure 29-1 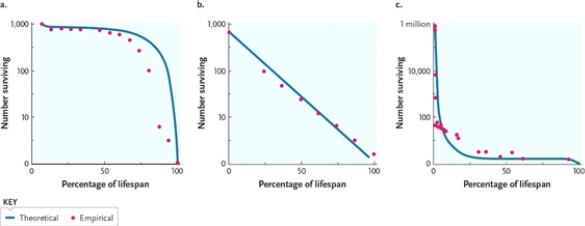
-Which survivorship curve in in Figure 29-1 best fits humans who live in environments with good medical care?
A) type I, shown in graph A
B) type I, shown in graph C
C) type III, shown in graph B
D) type III, shown in graph A
Correct Answer:

Verified
Correct Answer:
Verified
Related Questions
Q5: Match each term with its definition.<br>-population density<br>A)population
Q6: What caused a little dip in the
Q7: Match each description to an equation.<br>-change in
Q8: Which factor is a density-dependent regulator of
Q9: Suppose that a population of 100 animals
Q11: Which term refers to distributions that tend
Q12: Use the list of terms to identify
Q13: Number of offspring and the amount of
Q14: Why is controlling malaria an example of
Q15: Use the list of terms to identify