Multiple Choice
The line graph shows the costs of a 30-second television spot (in thousands of dollars) during the Super Bowl from 1995 to 2005. 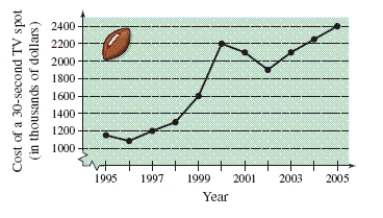 Estimate the increase in the cost of a 30-second spot from the Super Bowl in 2000 to the Super Bowl in 2005.
A) 300 thousand dollars
B) 200 thousand dollars
C) 100 thousand dollars
D) 400 thousand dollars
E) 360 thousand dollars
Correct Answer:

Verified
Correct Answer:
Verified
Q7: Factor the expression by removing the common
Q8: Find the special product. <img src="https://d2lvgg3v3hfg70.cloudfront.net/TB8632/.jpg" alt="Find
Q9: Identify the degree and leading coefficient of
Q10: Approximate the numbers and place the correct
Q13: Factor the expression by removing the common
Q15: Simplify the radical expression. <img src="https://d2lvgg3v3hfg70.cloudfront.net/TB8632/.jpg" alt="Simplify
Q16: Determine which numbers in the set are
Q17: List the coefficients of the variable terms
Q41: Use inequality notation to describe the
Q56: Use inequality notation to describe the