Multiple Choice
The line graph shows the costs of a 30-second television spot (in thousands of dollars) during the Super Bowl from 1995 to 2005. 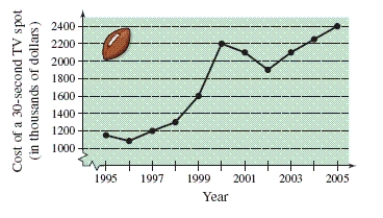 Estimate the increase in the cost of a 30-second spot from the Super Bowl in 1998 to the Super Bowl in 2002.
A) 1080 thousand dollars
B) 1200 thousand dollars
C) 300 thousand dollars
D) 900 thousand dollars
E) 600 thousand dollars
Correct Answer:

Verified
Correct Answer:
Verified
Q42: Factor out the common factor. <img src="https://d2lvgg3v3hfg70.cloudfront.net/TB8632/.jpg"
Q43: Write the rational expression in simplest form.
Q44: Write the polynomial in standard form. <img
Q46: Perform the operation and write the result
Q48: Completely factor the expression. <img src="https://d2lvgg3v3hfg70.cloudfront.net/TB8632/.jpg" alt="Completely
Q50: Simplify the radical expression. <img src="https://d2lvgg3v3hfg70.cloudfront.net/TB8632/.jpg" alt="Simplify
Q51: Evaluate the expression for the given value
Q52: Approximate the numbers and place the correct
Q68: Use inequality notation to describe the
Q115: Find the distance between the points. Round