Multiple Choice
The line graph shows the costs of a 30-second television spot (in thousands of dollars) during the Super Bowl from 1995 to 2005. 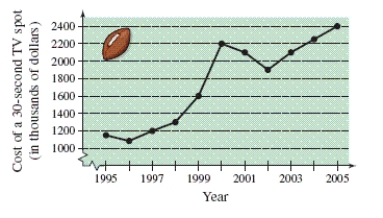 Estimate the increase in the cost of a 30-second spot from the Super Bowl in 1998 to the Super Bowl in 2005.
A) 550 thousand dollars
B) 2200 thousand dollars
C) 1650 thousand dollars
D) 1980 thousand dollars
E) 1100 thousand dollars
Correct Answer:

Verified
Correct Answer:
Verified
Q77: Perform the division and simplify. <img src="https://d2lvgg3v3hfg70.cloudfront.net/TB8632/.jpg"
Q78: Evaluate the expression. <img src="https://d2lvgg3v3hfg70.cloudfront.net/TB8632/.jpg" alt="Evaluate the
Q79: Evaluate the expression. <img src="https://d2lvgg3v3hfg70.cloudfront.net/TB8632/.jpg" alt="Evaluate the
Q80: Evaluate the expression. <img src="https://d2lvgg3v3hfg70.cloudfront.net/TB8632/.jpg" alt="Evaluate the
Q81: Simplify the expression. <img src="https://d2lvgg3v3hfg70.cloudfront.net/TB8632/.jpg" alt="Simplify the
Q83: Determine which numbers in the set are
Q85: Evaluate the expression for the given value
Q86: Factor the trinomial. <img src="https://d2lvgg3v3hfg70.cloudfront.net/TB8632/.jpg" alt="Factor the
Q87: Determine which numbers in the set are
Q96: Is the interval bounded or unbounded? -1