Multiple Choice
A graph of 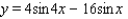 for
for  is shown in the figure. Find the exact values of the x-intercepts.
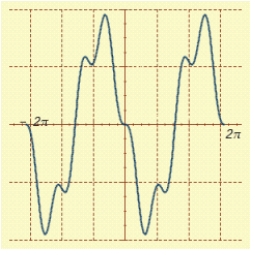
A) 
B) 
C) 
D) 
E) 
Correct Answer:

Verified
Correct Answer:
Verified
Q51: If an earthquake has a total horizontal
Q52: Verify the identity. <img src="https://d2lvgg3v3hfg70.cloudfront.net/TB8634/.jpg" alt="Verify the
Q53: Verify the identity. <img src="https://d2lvgg3v3hfg70.cloudfront.net/TB8634/.jpg" alt="Verify the
Q54: Express as a product. <img src="https://d2lvgg3v3hfg70.cloudfront.net/TB8634/.jpg" alt="Express
Q55: If a mass that is attached to
Q57: Verify the identity. <img src="https://d2lvgg3v3hfg70.cloudfront.net/TB8634/.jpg" alt="Verify the
Q58: Verify the identity. <img src="https://d2lvgg3v3hfg70.cloudfront.net/TB8634/.jpg" alt="Verify the
Q59: Tell whether the reduction formula is correct
Q60: Find an identical expression. <img src="https://d2lvgg3v3hfg70.cloudfront.net/TB8634/.jpg" alt="Find
Q61: Find the exact values of <img src="https://d2lvgg3v3hfg70.cloudfront.net/TB8634/.jpg"