Multiple Choice
A graph of 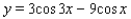 for
for  is shown in the figure. Find the exact values of the x-intercepts.
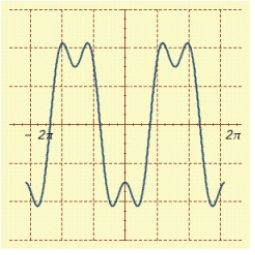
A) 
B) 
C) 
D) 
E) 
Correct Answer:

Verified
Correct Answer:
Verified
Related Questions
Q104: Find the exact values of <img src="https://d2lvgg3v3hfg70.cloudfront.net/TB8634/.jpg"
Q105: Use the graph of f to find
Q106: Verify the identity. <img src="https://d2lvgg3v3hfg70.cloudfront.net/TB8634/.jpg" alt="Verify the
Q107: Find the solutions of the equation that
Q108: Verify the identity. <img src="https://d2lvgg3v3hfg70.cloudfront.net/TB8634/.jpg" alt="Verify the
Q110: If an earthquake has a total horizontal
Q111: If an earthquake has a total horizontal
Q112: Shown in the figure is a graph
Q113: Use sum-to-product formulas to find the solutions
Q114: Express as a sum or difference. <img