Multiple Choice
The following graphs show the frequency of the b+ allele over 20 generations in two populations of heterozygous flour beetles (data for a population of 10 individuals is shown in graph A; data for a population of 100 individuals is shown in graph B) . Why does the frequency of the b+ allele increase in both populations? 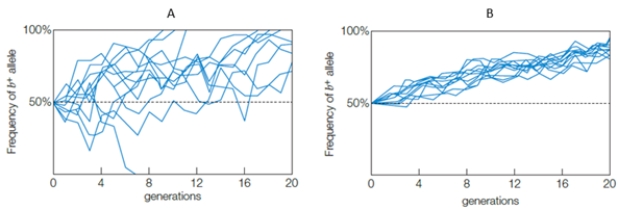
A) b+ is a lethal allele.
B) b+ is a balanced polymorphism.
C) b+ is a fixed allele.
D) b+ allele is adaptive.
E) b+ is a neutral mutation.
Correct Answer:

Verified
Correct Answer:
Verified
Q44: Mutations that result in the death of
Q45: Natural selection drives changes in allele frequencies
Q46: In the universal ABO blood grouping system,
Q47: The process of speciation always includes _
Q48: How are new combinations of alleles introduced
Q50: For each statement, select the genetic evolutionary
Q51: For each statement, select the best choice
Q52: Matching<br>For each statement, select the graph that
Q53: The Old Order Amish in Lancaster County
Q54: For each statement, select the genetic evolutionary