Multiple Choice
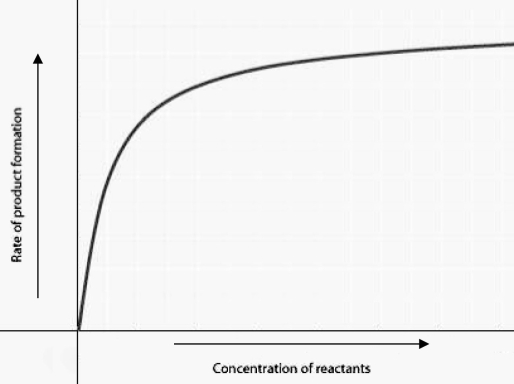 The figure displays the relationship between initial rate of product formation and reactant concentration in an enzyme-catalyzed reaction with a fixed amount of enzyme. Which of the following statements best explains the shape of the rate curve at high reactant concentration?
A) Feedback inhibition by product occurs at high reactant concentrations.
B) Most enzyme molecules are occupied by substrate at high reactant concentrations.
C) The reaction nears equilibrium at high reactant concentrations.
D) The rate of the reverse reaction increases at high reactant concentrations.
Correct Answer:

Verified
Correct Answer:
Verified
Q39: Disruption of the active site of an
Q40: A change of a single amino acid
Q41: When ATP is hydrolyzed to activate a
Q42: Use the following information to answer the
Q43: Zinc is an essential trace element for
Q45: An enzyme is composed of four identical
Q46: How does a noncompetitive inhibitor decrease the
Q47: Which of the following examples describes a
Q48: Which of the following statements best describes
Q49: A clasping handshake may be used as