Multiple Choice
Use the following graph and information to answer the question.
Flycatcher birds that migrate from Africa to Europe feed their chicks a diet that is almost exclusively moth caterpillars. The graph shows the peak dates of flycatcher arrival in Europe, bird hatching, and peak caterpillar season for the years 1980 and 2000. The y-axis is a measure of the abundance of birds, hatching chicks, and caterpillars. 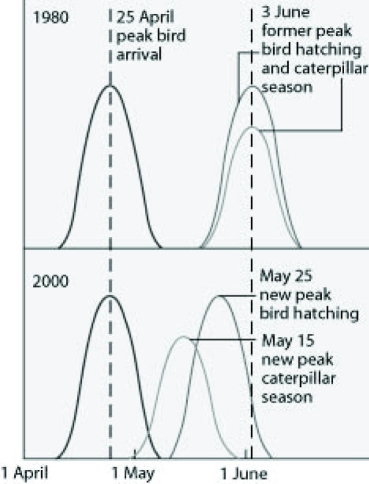
The shift in the peak of caterpillar season is most likely due to ________.
A) earlier migration returns of flycatchers
B) an innate change in the biological clock of the caterpillars
C) global climate change
D) acid precipitation in Europe
Correct Answer:

Verified
Correct Answer:
Verified
Q65: Use the following figure to answer the
Q66: Human-generated microplastics have thus been detected in
Q67: A parasitic fungus, Geomyces destructans, has decimated
Q68: Which of the following outcomes is caused
Q69: Philippe Bouchet and colleagues conducted a massive
Q70: Which of the following statements about protected
Q71: Which of the following is necessary in
Q73: Which of the following strategies was used
Q74: Which of the following is the most
Q75: Which of the following is an ecosystem