Multiple Choice
Use the graphs to answer the following question. 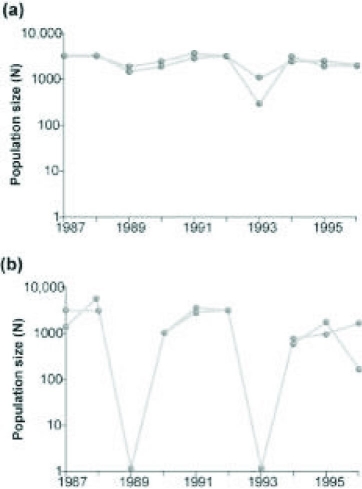 Graph (b) in the figure shows the normal fluctuations of a population of grouse, a ground-nesting bird. Assuming graph (a) in the figure is the result of some experimental treatment in the grouse population, what can be concluded?
A) The experimental treatment intensified the population cycling.
B) The experimental treatment did not affect population cycling in this species.
C) The experimental treatment has most likely identified the cause of population cycling.
D) The experimental treatment involved the introduction of a predator of the bird.
Correct Answer:

Verified
Correct Answer:
Verified
Q5: Use the graph to answer the following
Q6: Which of the following is most consistent
Q7: In April 2019, the population in the
Q8: Which of the following is consistent with
Q9: In 2019, the United States Census Bureau
Q11: Which of the following statements about human
Q12: Which of the following causes populations to
Q13: A researcher is studying two old-growth forests
Q14: A population of white-footed mice becomes severely
Q15: Use the figure to answer the following