Multiple Choice
Use the following figures to answer the question below. The figure depicts average temperatures and total precipitation across the 12 months of the year. Annual precipitation in Area 1 is approximately 260 cm, and in Area 2, 10 cm. 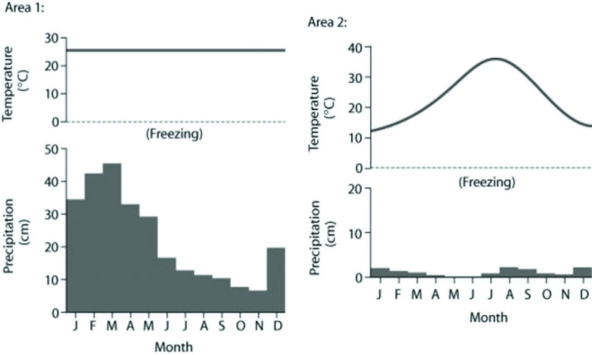 Based on the data in the figures, which of the following statements is most consistent with the data?
A) Area 1 is considered a hot desert because of its high average temperature, and it also has higher average precipitation than Area 2.
B) Area 1 has higher average precipitation than Area 2, and also has a larger annual temperature variation.
C) Area 2 is considered taiga.
D) Area 2 has a larger annual temperature variation, and it is considered a hot desert due to its low annual precipitation.
Correct Answer:

Verified
Correct Answer:
Verified
Q16: The oceans affect the biosphere in all
Q17: A certain species of pine tree survives
Q18: Two evolutionarily unrelated plant species may live
Q19: If global warming continues at its present
Q20: Use the following figure to answer the
Q22: Suppose that the number of bird species
Q23: In areas of permafrost, stands of black
Q24: Which of the following statements regarding turnover
Q25: Which of the following explains why seasonal
Q26: Which of the following biotic or abiotic