Multiple Choice
The eight panels below show average climatic values across the year on a monthly basis, as represented by first letter of each month depicted on the x-axis. Temperature values are depicted as a line graph and represented by the left vertical axis, while precipitation values are depicted as a bar graph and represented by the right vertical axis. 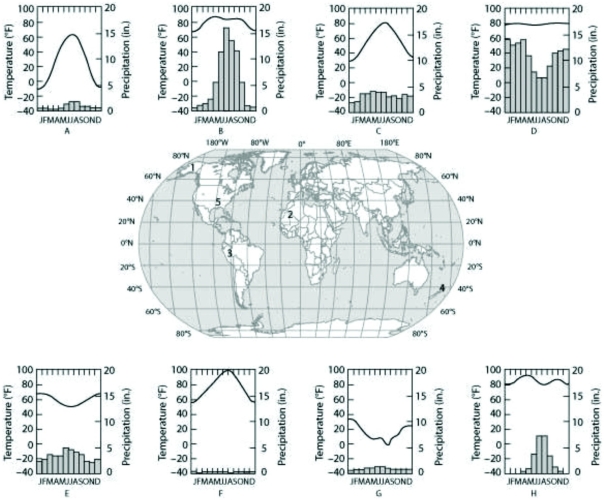 Which panel (A-H) most likely depicts the climate for location 2 as shown on the map in the center panel?
A) C
B) D
C) F
D) H
Correct Answer:

Verified
Correct Answer:
Verified
Q56: Generally, deserts are located in places where
Q57: Which of the following statements best describes
Q58: Which of the following best explains why
Q59: Hot deserts are characterized by which of
Q60: Which of the following examples demonstrates an
Q62: Which of the following environmental conditions poses/presents
Q63: Which of the following biomes has the
Q64: Studying species transplant can allow an ecologist
Q65: The eight panels below show average climatic
Q66: When climbing a mountain, we can observe