Multiple Choice
The eight panels below show average climatic values across the year on a monthly basis, as represented by first letter of each month depicted on the x-axis. Temperature values are depicted as a line graph and represented by the left vertical axis, while precipitation values are depicted as a bar graph and represented by the right vertical axis. 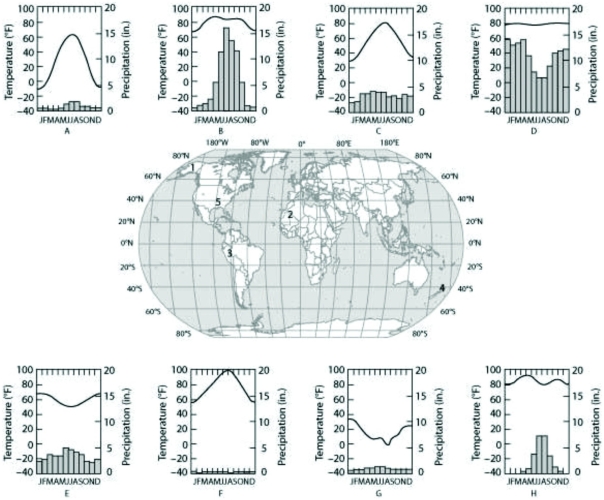 Which panel (A-H) most likely depicts the climate for location 5 as shown on the map in the center panel?
A) A
B) B
C) D
D) H
Correct Answer:

Verified
Correct Answer:
Verified
Q7: Which of the following sources of information
Q8: Use the following figure to answer the
Q9: If the direction of Earth's rotation reversed,
Q10: In the region of the Rocky Mountains,
Q11: Which of the following biomes spans a
Q13: Which statement about dispersal is the most
Q14: If a deep temperate zone lake did
Q15: Which of these environmental factors has the
Q16: The oceans affect the biosphere in all
Q17: A certain species of pine tree survives