Multiple Choice
The graph below shows daily water potential in the xylem of a woody plant. Which of the following statements is best supported using the data? 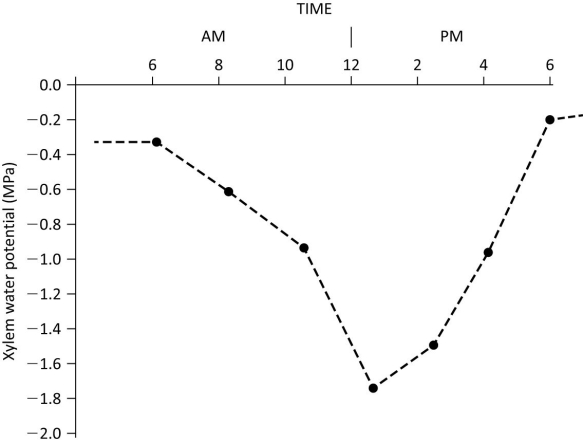
A) Water potential decreases, beginning around 6 am, because of increased mineral uptake.
B) High water potential results in greater transpiration.
C) Water potential at noon is a reflection of high rates of transpiration.
D) Increasing pressure potential after noon results in decreasing water potential.
Correct Answer:

Verified
Correct Answer:
Verified
Q16: Which of the following best predicts the
Q17: Which of the following are important components
Q18: The symplastic route can transport which of
Q19: Compared to a cell with few aquaporins
Q20: If you place a flaccid plant cell
Q22: Long-distance transport in phloem requires which of
Q23: A student examined a leaf and observed
Q24: Which of the following would tend to
Q25: Which one of the following statements about
Q26: The value for Ψ in root tissue