Essay
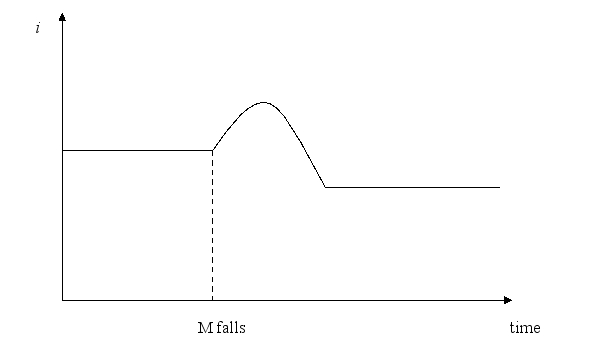
Use a graph of the interest rate against time to explain the effect of a decrease in the money supply when the liquidity effect is weaker the other effects.
Correct Answer:

Verified
The liquidity effect causes an initial i...View Answer
Unlock this answer now
Get Access to more Verified Answers free of charge
Correct Answer:
Verified
The liquidity effect causes an initial i...
View Answer
Unlock this answer now
Get Access to more Verified Answers free of charge
Related Questions
Q57: An increase in the expected return on
Q58: Which of the following shifts the demand
Q59: The end of the Cold War lowered
Q60: Using a graph of the supply and
Q61: If the interest rate falls, people will
Q63: An economic expansion can lead to higher
Q64: Which of the following affect(s) the demand
Q65: Which of the following affects the supply
Q66: The supply of bonds shifts to the
Q67: Corporations issue more bonds when<br>A) their stocks