Multiple Choice
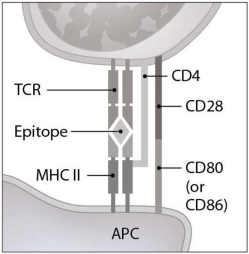 Figure 16.2 illustrates an interaction between a(n)
A) antigen presenting cell and a B lymphocyte.
B) antigen presenting cell and a T lymphocyte.
C) NK cell and its target cell.
D) CTL and its target cell.
E) antigen presenting cell and a plasma cell.
Correct Answer:

Verified
Correct Answer:
Verified
Q60: What is the result when a dendritic
Q61: <img src="https://d2lvgg3v3hfg70.cloudfront.net/TB1521/.jpg" alt=" The type of
Q62: What are the steps involved in B
Q63: Blood plasma enters the lymphatic capillaries directly
Q64: IgE antibodies are best described as<br>A) a
Q66: The antibody-binding site of an antibody is
Q67: The IgG molecules which cross the placenta
Q68: The perforin-granzyme pathway involves<br>A) the production of
Q69: The (constant/ hinge/variable) regions from the light
Q70: The adaptive immune response requires exposure to