Multiple Choice
Draw a scatter plot of the data given in the table.
-The number ( ) of computers (in thousands) sold in a certain state for each year from 1994 to 1999 is given in the table below.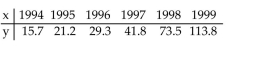
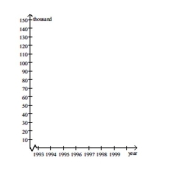
A) 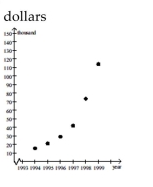
B) 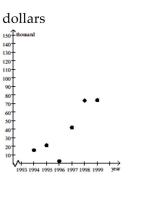
C) 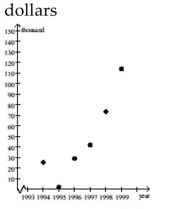
D) 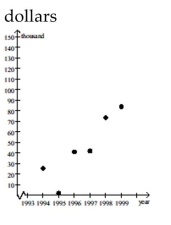
Correct Answer:

Verified
Correct Answer:
Verified
Related Questions
Q50: Use interval notation to describe the
Q51: Determine the equation of the line
Q52: Solve the equation by extracting the
Q53: Draw a scatter plot of the data
Q54: Use interval notation to describe the
Q56: Provide an appropriate response.<br>-If the
Q57: Solve the inequality graphically.<br>- <span class="ql-formula"
Q58: Solve the problem.<br>-Assume that the sales of
Q59: Use an inequality to describe the
Q60: <img src="https://d2lvgg3v3hfg70.cloudfront.net/TB8181/.jpg" alt=" -What was the