Multiple Choice
Draw a scatter plot of the data given in the table.
-The total in billions of dollars of Canadian farm trade surplus to a particular country from 1996 to 1999 is given in the following table.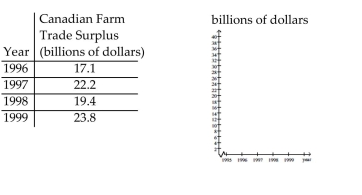
A) billions of dollars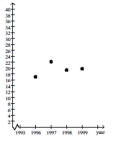
B) billions of dollars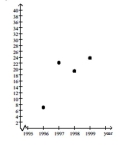
C) billions of dollars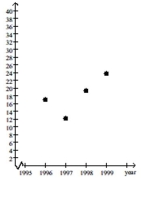
D) billions of dollars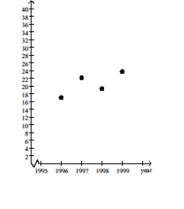
Correct Answer:

Verified
Correct Answer:
Verified
Q127: Solve the equation.<br>- <span class="ql-formula" data-value="16
Q128: Find the slope of the line
Q129: Solve the inequality.<br>- <span class="ql-formula" data-value="\frac
Q130: <img src="https://d2lvgg3v3hfg70.cloudfront.net/TB8181/.jpg" alt=" -What was the
Q131: Solve the equation.<br>- <span class="ql-formula" data-value="x
Q133: Use an inequality to describe the
Q134: Solve the equation.<br>- <span class="ql-formula" data-value="\frac
Q135: Find the value of x or
Q136: Use a method of your choice
Q137: Solve by completing the square.<br>- <span