Multiple Choice
Describe the shape of the distribution.
-A stemplot is given below for the annual precipitation in one U.S. city for 28 consecutive years. Precipitation data are in inches.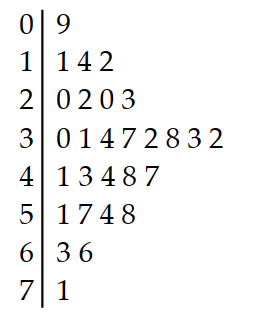
A) Left skewed, unimodal
B) Right skewed, unimodal
C) Symmetric, unimodal
D) Bimodal
Correct Answer:

Verified
Correct Answer:
Verified
Q133: Eleven dimes dated 1989 through 1999 are
Q134: Find the probability of the event.<br>-Give the
Q135: Find the probability.<br>-A 7-card hand is dealt
Q136: Identify the following as an experiment or
Q137: Describe the shape of the distribution.<br>-A histogram
Q139: Find the probability of the event.<br>-A coin
Q140: Solve the problem.<br>-Suppose you receive a shipment
Q141: Find the mean for the given sample
Q142: Obtain the population standard deviation,σ, for the
Q143: Obtain the population standard deviation,σ, for the