Multiple Choice
Solve the problem.
-The table shows the total amount of precipitation (in inches) in a certain US city in 16 different years. Find the range. 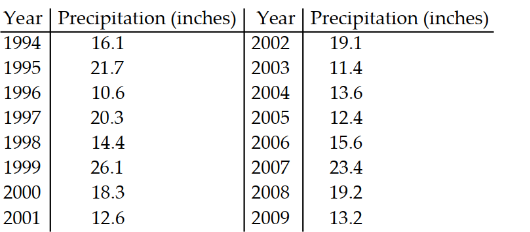
A) 12 in.
B) 12.8 in.
C) 15.5 in.
D) 14.7 in.
Correct Answer:

Verified
Correct Answer:
Verified
Related Questions
Q19: Identify whether the number described is a
Q20: Identify the following as an experiment or
Q21: Find the mean. Round to the nearest
Q22: Identify whether the average described is a
Q23: Solve the problem.<br>-A and B are events
Q25: Find the weighted average.<br>-Michael gets test grades
Q26: Eleven dimes dated 1989 through 1999 are
Q27: Identify the following as an experiment or
Q28: Find the probability of the event.<br>-If two
Q29: Identify the following as an experiment or