Multiple Choice
Solve the problem.
-Some of the results of an analysis, on the makeup of garbage, are given in the following table. The table displays various years which gives the number of pounds per person per day of various types of waste materials.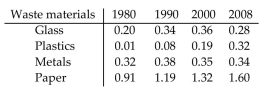
For glass, calculate the average rate of change between 1990 and 2000 . Then interpret what this value means.
A) From 1990 to 2000 , the number of pounds of glass per person per day decreased by per year.
B) From 1990 to 2000, the number of pounds of glass per person per day increased by per year.
C) From 1990 to 2000 , the number of pounds of glass per person per day increased by per year.
D) From 1990 to 2000 , the number of pounds of glass per person per day decreased by per year.
Correct Answer:

Verified
Correct Answer:
Verified
Q313: Consider the functions f and g as
Q314: Choose the one alternative that best
Q315: Choose the one alternative that best
Q316: Solve the problem.<br>-Mardi received an inheritance of
Q317: Write the word or phrase that best
Q319: Find f(x) and g(x) so that
Q320: Match the function with the graph.<br>-<img
Q321: Sketch the graph of y1 as
Q322: Sketch the graph of y1 as
Q323: Write the word or phrase that