Multiple Choice
Solve the problem.
-Some of the results of an analysis, on the makeup of garbage, are given in the following table. The table displays various years which gives the number of pounds per person per day of various types of waste materials.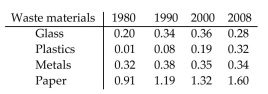
For paper, calculate the average rates of change between consecutive data points in the table. Interpret the meani your results.
A) The rate of increase slows down during the 1980's, but then increases during the 1990's and 2000-2008.
B) The rate of increase slows down during the 1990's, but then increases during 2000-2008.
C) The rate of increase increases during the 1990 's, but then decreases during 2000-2008.
D) The rate of increase stays the same from the 1980's through 2000-2008.
Correct Answer:

Verified
Correct Answer:
Verified
Q348: Find the asymptote(s) of the given
Q349: Tell which of the following types of
Q350: Match the function with the graph.<br>-<img
Q351: Choose the one alternative that best
Q352: Sketch the graph of y1 as
Q354: Find the domain of the given
Q355: Describe how to transform the graph
Q356: Determine algebraically whether the function is
Q357: Choose the one alternative that best
Q358: Write the word or phrase that