Multiple Choice
Solve the problem.
-Some of the results of an analysis, on the makeup of garbage, are given in the following table. The table displays various years which gives the number of pounds per person per day of various types of waste materials.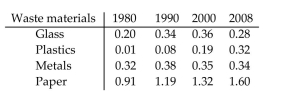
For plastics, calculate the average rates of change between consecutive data points in the table. Interpret the mea your results.
A) The rate of increase decreases from each decade to the next.
B) The rate of increase increases from each decade to the next.
C) The rate of increase decreases during the 1990 's, but then increases during 2000-2008.
D) The rate of increase increases during the 1990 's, but then decreases during the 2000-2008.
Correct Answer:

Verified
Correct Answer:
Verified
Q195: Solve the problem.<br>-Estimate graphically the local
Q196: Give the equation of the function
Q197: Find the inverse of the function.<br>-
Q198: Match the function with the graph.<br>-<img
Q199: Choose the one alternative that best
Q201: Find the domain of the given
Q202: Describe how to transform the graph
Q203: Fill in the blanks to complete
Q204: Find the asymptote(s) of the given
Q205: Solve the problem.<br>-The following information pertains