Multiple Choice
Solve the problem.
-The graph depicts a person's speed , in miles per hour, during a 15 -minute period of driving.
The graph has two turning points.The first turning point is the point at which the graph stops rising and starts to The second turning point is the point at which the graph stops falling and starts to rise again.
Estimate and interpret the turning points.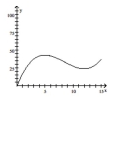
A) The first turning point is at approximately . This is where the person's distance from the starting point stops increasing and starts to decrease. The second turning point is at approximately . This is where the person's distance from the starting point stops decreasing and starts to increase again.
B) The first turning point is at approximately . This is where the person's distance from the starting point stops increasing and starts to decrease. The second turning point is at approximately . This is where the person's distance from the starting point stops decreasing and starts to increase again.
C) The first turning point is at approximately . This is where the person's speed first stops increasing and starts to decrease. The second turning point is at approximately . This is where the person's speed stops decreasing and starts to increase again.
D) The first turning point is at approximately . This is where the person's speed first stops increasing and starts to decrease. The second turning point is at approximately . This is where the person's speed stops decreasing and starts to increase again.
Correct Answer:

Verified
Correct Answer:
Verified
Q301: Determine algebraically whether the function is
Q302: Write the specified quantity as a
Q303: Write the word or phrase that
Q304: Find the range of the function.<br>-
Q305: Find f(x) and g(x) so that
Q307: Solve the problem.<br>-A high-altitude spherical weather
Q308: Choose the one alternative that best
Q309: True or False. The function
Q310: Give the equation of the function
Q311: Solve the problem.<br>-An airplane leaves Los Angeles