Multiple Choice
Figure 53-3
Use the figure to answer the corresponding question(s) . 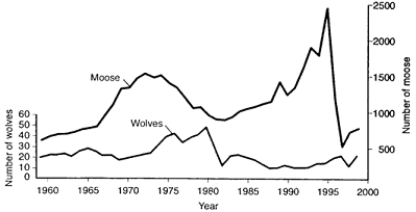
-Based on Figure 53-3, the decline in the moose population in 1996 was most likely due to:
A) a predictable increase in the wolf population.
B) an unpredictable increase in the wolf population.
C) a decrease in the intrinsic rate of increase for the moose population.
D) a decline in the food supply.
E) an unknown disease organism.
Correct Answer:

Verified
Correct Answer:
Verified
Q4: Density-independent factors:<br>A) influence population size and are
Q10: The average number of children born to
Q23: Compare and contrast Type I and Type
Q32: In a population characterized by type III
Q53: The most common spacing is random dispersion.
Q59: Natural selection acts most directly on:<br>A) populations.<br>B)
Q81: Iteroparity is common in which of the
Q82: The largest population that can be maintained
Q84: An example of a density-dependent factor that
Q97: An exponential growth curve levels off at