Multiple Choice
Figure 53-3
Use the figure to answer the corresponding question(s) . 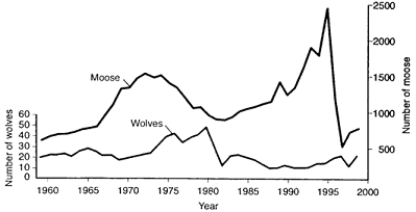
-Using the data in Figure 53-3, the cause of the decline of the wolf population in 1982 was:
A) a sharp decrease in food supply.
B) a decrease in the intrinsic rate of increase for the wolf population.
C) competition with a newly introduced predator.
D) introduction of a disease organism.
E) cannot be determined from the data provided.
Correct Answer:

Verified
Correct Answer:
Verified
Q17: In a human population with a high
Q21: Figure 53-5<br>Use the figure to answer the
Q24: A human population that is shrinking would
Q26: Surplus individuals in the _ disperse and
Q27: These generally have greater population densities than
Q28: Which of the following series correctly
Q29: The best definition of population density is:<br>A)
Q30: This British clergyman and economist was one
Q65: K strategists typically produce large numbers of
Q92: Source habitats are areas where reproductive success