Multiple Choice
Figure 53-4
Use the figure to answer the corresponding question(s) . 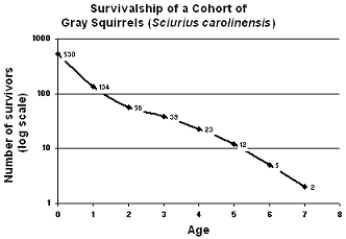
-Figure 53-4 is representative of:
A) exponential growth.
B) iteroparity.
C) Type I survivorship.
D) Type III survivorship.
E) Type II survivorship.
Correct Answer:

Verified
Correct Answer:
Verified
Related Questions
Q3: The world human population has increased dramatically
Q12: MATCHING<br>Match the term in a growth rate
Q14: Clumped dispersion is often influenced by all
Q15: Oysters have a Type-II survivorship curve.<br>_
Q16: MATCHING<br>Match the term in a growth rate
Q18: When two members of the same species
Q21: Figure 53-5<br>Use the figure to answer the
Q65: K strategists typically produce large numbers of
Q68: A population that is divided into several
Q92: Source habitats are areas where reproductive success