Multiple Choice
Figure 53-6
Use the figure to answer the corresponding question(s) . 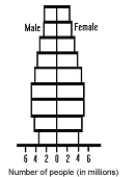
-If the pattern remains the same, in 50 years the population in Figure 53-6 would:
A) be experiencing slow growth.
B) be experiencing rapid growth.
C) be experiencing steady state growth.
D) be experiencing negative growth.
E) No prediction could be made using these data.
Correct Answer:

Verified
Correct Answer:
Verified
Q31: By the end of the 21<sup>st</sup> century,
Q50: The percentages of a population at different
Q58: What would be the growth rate (r)
Q59: MATCHING<br>Match the term in a growth rate
Q61: MATCHING<br>Match the term in a growth rate
Q62: Figure 53-4<br>Use the figure to answer the
Q65: Figure 53-2<br>Use the figure to answer the
Q66: Which of the following pairs is incorrect?<br>A)
Q67: MATCHING<br>Match the term in a growth rate
Q90: Sketch an exponential growth curve with correctly