Multiple Choice
The line graph shows the costs of a 30-second television spot (in thousands of dollars) during the Super Bowl from 1995 to 2005. 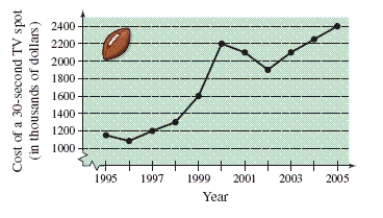 Estimate the increase in the cost of a 30-second spot from the Super Bowl in 2000 to the Super Bowl in 2005.
A) 300 thousand dollars
B) 200 thousand dollars
C) 100 thousand dollars
D) 400 thousand dollars
E) 360 thousand dollars
Correct Answer:

Verified
Correct Answer:
Verified
Q14: Evaluate the expression. <img src="https://d2lvgg3v3hfg70.cloudfront.net/TB8693/.jpg" alt="Evaluate the
Q15: Approximate the numbers and place the correct
Q16: Identify the degree and leading coefficient of
Q17: Evaluate the expression. <img src="https://d2lvgg3v3hfg70.cloudfront.net/TB8693/.jpg" alt="Evaluate the
Q18: The double bar graph below shows the
Q19: Use inequality notation to describe the
Q20: Evaluate the expression. <img src="https://d2lvgg3v3hfg70.cloudfront.net/TB8693/.jpg" alt="Evaluate the
Q22: Place the correct symbol (<, >, or
Q23: Perform the subtraction and simplify. <img src="https://d2lvgg3v3hfg70.cloudfront.net/TB8693/.jpg"
Q24: Simplify the expression. <img src="https://d2lvgg3v3hfg70.cloudfront.net/TB8693/.jpg" alt="Simplify the