Multiple Choice
The line graph shows the costs of a 30-second television spot (in thousands of dollars) during the Super Bowl from 1995 to 2005. 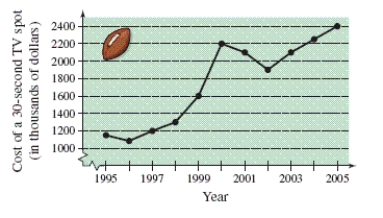 Estimate the increase in the cost of a 30-second spot from the Super Bowl in 2000 to the Super Bowl in 2005.
A) 300 thousand dollars
B) 200 thousand dollars
C) 100 thousand dollars
D) 400 thousand dollars
E) 360 thousand dollars
Correct Answer:

Verified
Correct Answer:
Verified
Q80: Rationalize the denominator. Then simplify your answer.
Q81: Factor the difference of two squares. <img
Q82: Evaluate the expression. <img src="https://d2lvgg3v3hfg70.cloudfront.net/TB8633/.jpg" alt="Evaluate the
Q83: Perform the division and simplify. <img src="https://d2lvgg3v3hfg70.cloudfront.net/TB8633/.jpg"
Q84: Write the polynomial in standard form. <img
Q86: Factor the trinomial. <img src="https://d2lvgg3v3hfg70.cloudfront.net/TB8633/.jpg" alt="Factor the
Q87: Use absolute value notation to describe the
Q88: Simplify the radical expression. <img src="https://d2lvgg3v3hfg70.cloudfront.net/TB8633/.jpg" alt="Simplify
Q89: Perform the division and simplify. <img src="https://d2lvgg3v3hfg70.cloudfront.net/TB8633/.jpg"
Q90: List the coefficients of the variable terms