Multiple Choice
The line graph shows the costs of a 30-second television spot (in thousands of dollars) during the Super Bowl from 1995 to 2005. 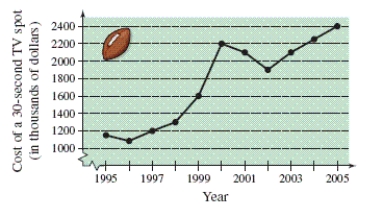 Estimate the increase in the cost of a 30-second spot from the Super Bowl in 1998 to the Super Bowl in 2002.
A) 1080 thousand dollars
B) 1200 thousand dollars
C) 300 thousand dollars
D) 900 thousand dollars
E) 600 thousand dollars
Correct Answer:

Verified
Correct Answer:
Verified
Q132: Simplify the complex fraction. <img src="https://d2lvgg3v3hfg70.cloudfront.net/TB8633/.jpg" alt="Simplify
Q133: Identify the degree and leading coefficient of
Q134: Find the domain of the expression. <img
Q135: Evaluate the expression without using a calculator.
Q136: Approximate the numbers and place the correct
Q138: Perform the operation and write the result
Q139: Determine which numbers in the set are
Q140: Simplify the complex fraction. <img src="https://d2lvgg3v3hfg70.cloudfront.net/TB8633/.jpg" alt="Simplify
Q141: Evaluate the expression without using a calculator.
Q142: Write the polynomial in standard form. <img