Multiple Choice
Find the value of b that would cause the graph of y = bx to look like the graph indicated. 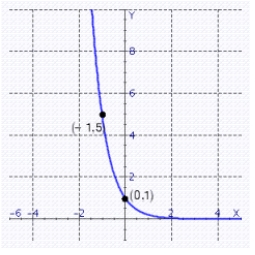
A) 
B) 
C) 
D) 
E) 
Correct Answer:

Verified
Correct Answer:
Verified
Related Questions
Q129: Identify the x-intercept of the function <img
Q130: Use a calculator to find a value
Q131: Evaluate the function <img src="https://d2lvgg3v3hfg70.cloudfront.net/TB8633/.jpg" alt="Evaluate the
Q132: Find the graph of the function. <img
Q133: What is the value of the function
Q135: Assume that x, y, and c are
Q136: Assume that x is a positive number.
Q137: A population growing at an annual rate
Q138: Rewrite the logarithm <img src="https://d2lvgg3v3hfg70.cloudfront.net/TB8633/.jpg" alt="Rewrite the
Q139: Condense the expression <img src="https://d2lvgg3v3hfg70.cloudfront.net/TB8633/.jpg" alt="Condense the