Multiple Choice
The diagram below shows a light curve from a supernova. How many days after maximum light did it take for the supernova to decrease in brightness by a factor of 100? 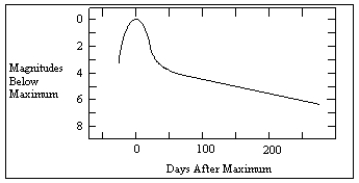
A) less than 50
B) 50
C) 150
D) 250
E) more than 250
Correct Answer:

Verified
Correct Answer:
Verified
Related Questions
Q38: What is the difference between a planetary
Q56: Star clusters are important to our study
Q59: Stars in a star cluster<br>A) all have
Q60: An accretion disk can grow hot enough
Q63: The triple-alpha process<br>A) controls the pulsations in
Q64: The explosion of a supernova typically leaves
Q65: A Type I supernova is believed to
Q69: Planetary nebulae are sites of planet formation.
Q96: A(n) _ is a collection of 10<sup>5</sup>
Q123: A Type II supernova produces a planetary