Multiple Choice
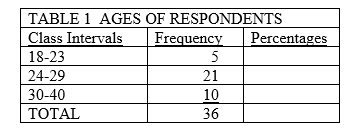
-A possible problem with Table 1 is that
A) class intervals overlap
B) class intervals are too large
C) class intervals are unequal in size
D) class intervals are exhaustive
Correct Answer:

Verified
Correct Answer:
Verified
Q5: City A (population = 1567 people)had 34
Q9: As a very general rule,frequency distributions should
Q20: Proportions and percentages, ratios and rates are
Q27: A police department reports that the number
Q29: The homicide rate for a city is
Q34: According to the text book, the rate
Q35: A frequency distribution should reflect a balance
Q35: <img src="https://d2lvgg3v3hfg70.cloudfront.net/TB8916/.jpg" alt=" -In Table 2,
Q36: <img src="https://d2lvgg3v3hfg70.cloudfront.net/TB8916/.jpg" alt=" -In Table 1,
Q38: <img src="https://d2lvgg3v3hfg70.cloudfront.net/TB8916/.jpg" alt=" -In Table 2,