Multiple Choice
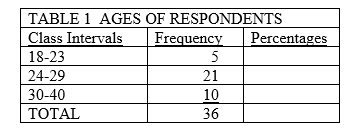
-In Table 1, what percentage of cases is in the 18-23 age group?
A) ( 5/36) x 100 = 13.51%
B) (18/23) x 100 = 78.26%
C) (36/ 5) x 100 = 7.4%
D) ( 5/21) x 100 = 23.81%
Correct Answer:

Verified
Correct Answer:
Verified
Related Questions
Q2: According to the report discussed in the
Q3: When working with a very small number
Q4: For a single variable at the interval-ratio
Q7: A possible problem with open-ended or unequal
Q8: According to information presented in the text,
Q11: <img src="https://d2lvgg3v3hfg70.cloudfront.net/TB8916/.jpg" alt=" -In Table 2,
Q22: To calculate a proportion, the number of
Q24: Histograms and line charts or frequency polygons
Q29: Frequency distributions may be compiled for variables
Q30: The sum of the proportions for all