Multiple Choice
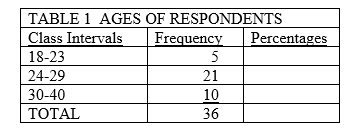
-In Table 1, what proportion of cases are 18-23?
A) 0.05
B) 0.36
C) 0.78
D) 0.13
Correct Answer:

Verified
Correct Answer:
Verified
Related Questions
Q7: For a single variable measured at the
Q8: Twenty-three of the 50 states rejected a
Q10: To be converted to a percentage,the proportion
Q12: Which of the following is an impossible
Q13: When constructing frequency distributions for variables measured
Q28: Pie charts show the frequency distribution of<br>A)one
Q38: <img src="https://d2lvgg3v3hfg70.cloudfront.net/TB8916/.jpg" alt=" -In Table 2,
Q38: The midpoints of intervals for frequency distributions
Q41: A researcher wants to visually display the
Q46: A line chart or frequency polygon is