Multiple Choice
Figure 36-1 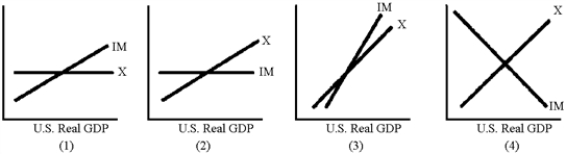
-Which of the graphs in Figure 36-1 best illustrates the behavior of exports and imports in relation to U.S.real GDP?
A) 1
B) 2
C) 3
D) 4
Correct Answer:

Verified
Correct Answer:
Verified
Related Questions
Q96: In the 1990s, the United States eliminated
Q97: If Asian economies suffer a serious economic
Q98: Table 36-2<br> <img src="https://d2lvgg3v3hfg70.cloudfront.net/TB8592/.jpg" alt="Table 36-2
Q99: A currency depreciation would _ net exports,
Q100: Between 1981 and 1986, as the federal
Q102: Suppose the dollar depreciates from 89 Japanese
Q103: The worst remedy for curing the U.S.trade
Q104: The growing federal budget deficit in the
Q105: Because monetary stimulus overwhelmed fiscal contraction in
Q106: A decline in interest rates tends to