Multiple Choice
Figure 36-2 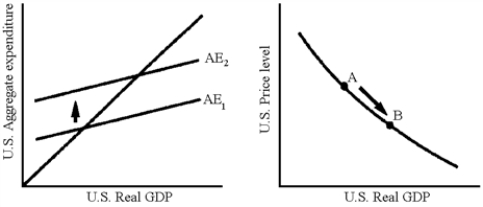
-Which of the following explains the movements in Figure 36-2?
A) An increase in U.S.imports
B) A decrease in U.S.exports
C) An increase in U.S.exports
D) A decrease in U.S.net exports
Correct Answer:

Verified
Correct Answer:
Verified
Related Questions
Q205: How does a budget deficit lead to
Q206: The reason that higher interest rates reduce
Q207: If the United States increased its budget
Q208: A closed economy is one that does
Q209: If the demand effect dominates during a
Q211: A rise in interest rates tends to
Q212: In the mid-1990s, real interest rates fell
Q213: Explain how and why economic events in
Q214: An appreciation of the Japanese yen relative
Q215: Figure 36-9<br> <img src="https://d2lvgg3v3hfg70.cloudfront.net/TB8592/.jpg" alt="Figure 36-9