Multiple Choice
Figure 36-5
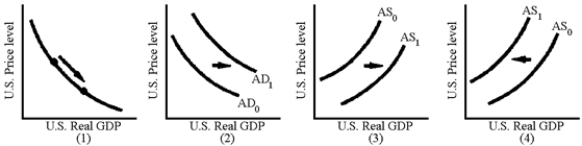
-Which of the graphs in Figure 36-5 are consistent with a depreciation of the U.S.dollar and an increase in net exports caused by a decrease in U.S.interest rates?
A) 1
B) 2
C) 3
D) 4
Correct Answer:

Verified
Correct Answer:
Verified
Q163: When the dollar appreciates, the cost to
Q164: The depreciation of the Japanese yen in
Q165: One of the results of the strong
Q166: What does macroeconomic theory predict as the
Q167: If currency depreciates,<br>A)net exports rise and the
Q169: The expected effect of the Bush tax
Q170: International capital flows in an open economy
Q171: The expected effects of a tighter monetary
Q172: An expansionary fiscal policy will lead to<br>A)higher
Q173: Table 36-2<br> <img src="https://d2lvgg3v3hfg70.cloudfront.net/TB8592/.jpg" alt="Table 36-2