Multiple Choice
Figure 36-8
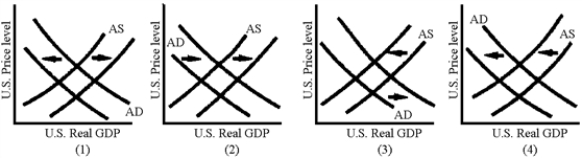
-Which of the graphs in Figure 36-8 represents the effects of a currency appreciation?
A) 1
B) 2
C) 3
D) 4
Correct Answer:

Verified
Correct Answer:
Verified
Related Questions
Q37: Depreciation of the Japanese yen would lead
Q38: The saving rate in the United States
Q39: As the international value of the dollar
Q40: The different effects of fiscal and monetary
Q41: Figure 36-6<br> <img src="https://d2lvgg3v3hfg70.cloudfront.net/TB8592/.jpg" alt="Figure 36-6
Q43: Explain how exchange rates affect the level
Q44: Despite the monetary expansion of the 1992-2000
Q45: A currency depreciation<br>A)reduces aggregate demand and increases
Q46: What effect did the decrease in the
Q47: For a major country with extensive capital