Multiple Choice
Figure 36-8
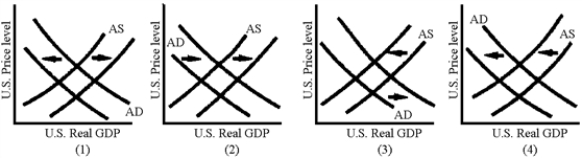
-Which of the graphs in Figure 36-8 illustrates the AD-AS shifts induced by the foreign sector following an increase in the U.S.federal deficit?
A) 1
B) 2
C) 3
D) 4
Correct Answer:

Verified
Correct Answer:
Verified
Q170: International capital flows in an open economy
Q171: The expected effects of a tighter monetary
Q172: An expansionary fiscal policy will lead to<br>A)higher
Q173: Table 36-2<br> <img src="https://d2lvgg3v3hfg70.cloudfront.net/TB8592/.jpg" alt="Table 36-2
Q174: If the federal government has a deficit,
Q176: International capital flows strengthen<br>A)monetary policy and have
Q177: A decline in interest rates tends to
Q178: When the dollar depreciates, the prices of
Q179: When the dollar appreciates, the prices of
Q180: If European economies experience a period of