Multiple Choice
Figure 36-8
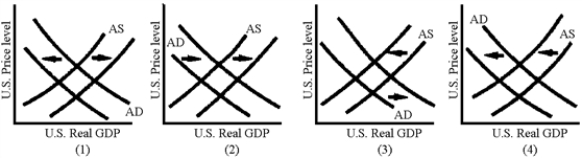
-Which of the graphs in Figure 36-8 illustrates the AD-AS shifts associated with an expansionary monetary policy?
A) 1
B) 2
C) 3
D) 4
Correct Answer:

Verified
Correct Answer:
Verified
Related Questions
Q197: Figure 36-3<br> <img src="https://d2lvgg3v3hfg70.cloudfront.net/TB8592/.jpg" alt="Figure 36-3
Q198: An increase in the price level in
Q199: Compare the effectiveness of monetary policy in
Q200: If (T − G) = (X −
Q201: Figure 36-5<br> <img src="https://d2lvgg3v3hfg70.cloudfront.net/TB8592/.jpg" alt="Figure 36-5
Q203: In the spring of 2002, the United
Q204: Did the large U.S.budget deficits in the
Q205: How does a budget deficit lead to
Q206: The reason that higher interest rates reduce
Q207: If the United States increased its budget