Multiple Choice
Figure 36-8
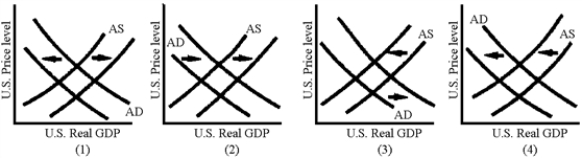
-Which of the graphs in Figure 36-8 illustrates the AD-AS shifts associated with a currency depreciation?
A) 1
B) 2
C) 3
D) 4
Correct Answer:

Verified
Correct Answer:
Verified
Related Questions
Q18: Economic theory shows that the current account
Q19: International capital flows are purchases and sales
Q20: Booms or recessions in one country tend
Q21: In an open economy, the government deficit
Q22: One of the principal factors behind the
Q24: If the government budget is balanced, and
Q25: An economic boom in the United States
Q26: What are the results of a contractionary
Q27: A currency appreciation is disinflationary and contractionary
Q28: International capital inflows reduce the power of