Multiple Choice
Figure 19-1
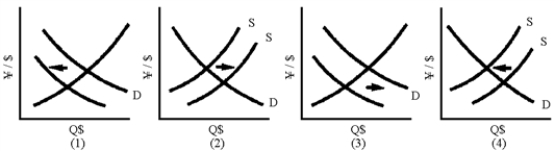
-Of the graphs in Figure 19-1, which one shows that an expansion of the Japanese economy leads to a depreciation of the yen?
A) 1
B) 2
C) 3
D) 4
Correct Answer:

Verified
Correct Answer:
Verified
Related Questions
Q132: What is the euro and why has
Q133: The current account balance includes international purchases
Q134: Floating exchange rates are rates determined in
Q135: On June 3, 2005, it cost 1.22
Q138: If nations erect tariffs and quotas to
Q139: As the U.S.dollar's foreign-exchange value falls, we
Q140: The current role of the International Monetary
Q141: Table 19-1<br> <img src="https://d2lvgg3v3hfg70.cloudfront.net/TB8592/.jpg" alt="Table 19-1
Q142: Under the Bretton Woods system, a country
Q162: If a Mexican pension fund decides to